
While there’s a lot to cover when it comes to social media trends, insights and numbers, we’ve collected and grouped some key insights. Mainly to get a feel of the top social media platforms for deciding where you want to place the largest chunk of your social media marketing efforts on.
There are some key takeaways we can already deduce from the infographic below. For instance, we can see that Facebook continues to be the king of social media with 2.74+ billion monthly active users and there are basically only 5 social/community platforms with at least 1 billion monthly active users at the moment.
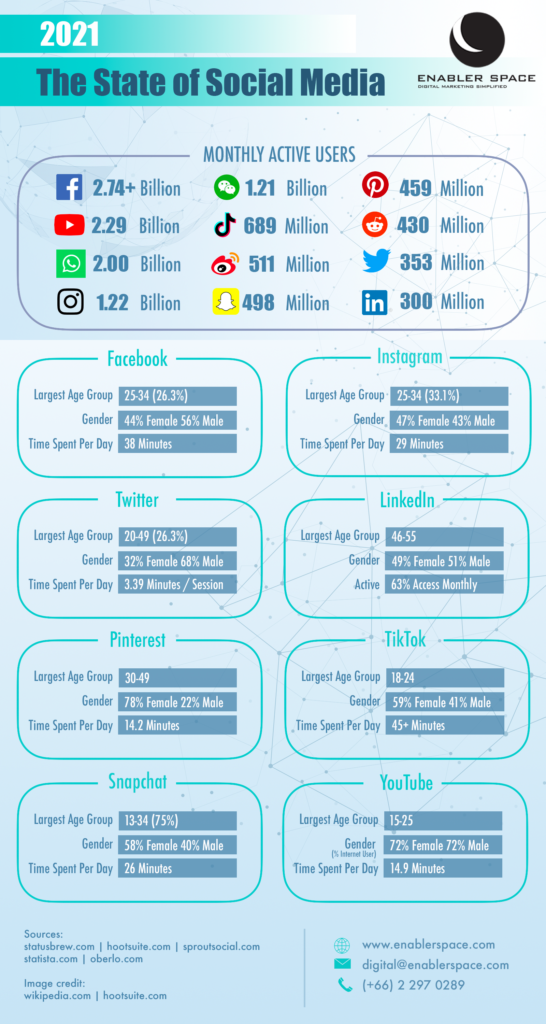
Monthly active users for top social media platforms:
- Facebook: 2.74+ billion
- Youtube: 2.29 billion
- WhatsApp: 2.00 billion
- Instagram: 1.22 billion
- WeChat: 1.21 billion
- Tik Tok: 689 million
- Sina Weibo: 511 million
- Snapchat: 498 million
- Pinterest: 459 million
- Reddit: 430 million
- Twitter 353 million
- LinkedIn 300 million
And some key numbers for selected platforms:
- Largest age group: 35-34 years old (26.3% of total users)
- Gender distribution: 44% female 56% male
- Time spent per day: 38 minutes
- Largest age group: 25-34 years old (33.1% of total users)
- Gender distribution: 47% female 43% male
- Time spent per day: 29 minutes
- Largest age group: 20-49 years old (26.3% of total users)
- Gender distribution: 32% female 68% male
- Time spent per day: 3.39 minutes (per session)
- Largest age group: 46-55 years old
- Gender distribution: 49% female 51% male
- Time spent on platform: 63% access monthly
TikTok
- Largest age group: 18-24 years old
- Gender distribution: 59% female 41% male
- Time spent per day: 45+ minutes
Sources: statusbrew.com | hootsuite.com | sproutsocial.com | statista.com | oberlo.com